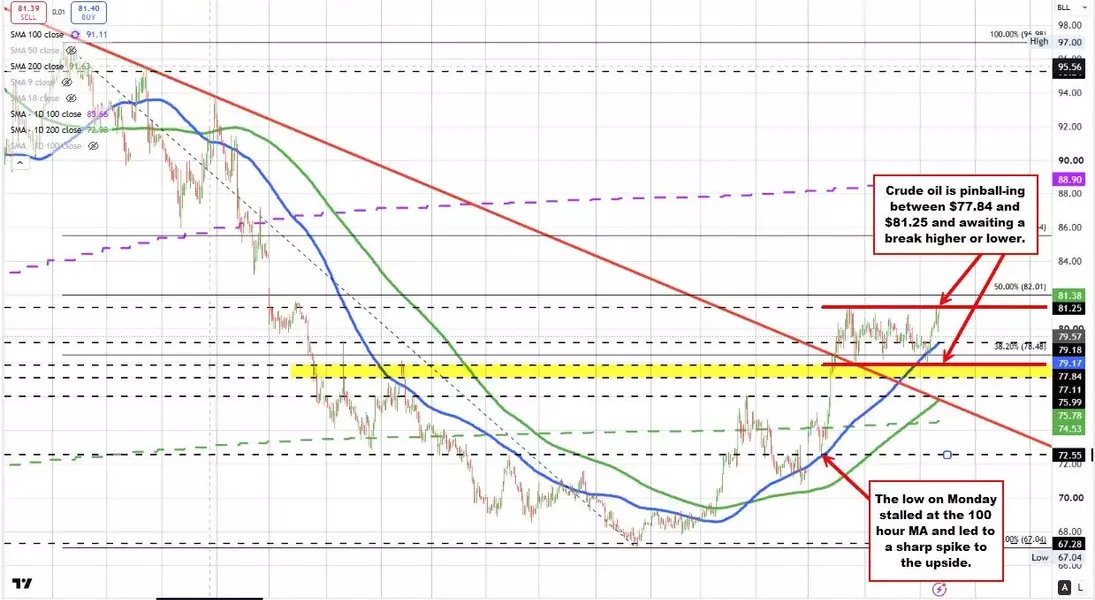
Crude oil futures have exhibited a dynamic pattern this week, oscillating within defined technical boundaries. This activity began with a notable rally after prices found support at the 100-hour moving average near .55. This upward movement successfully breached a descending trend line, propelling prices to a peak of .25 on Tuesday, narrowly missing the 50% retracement level from the early June high.
Following this initial surge, the market reversed, retreating to the previous trend line support around .84. This level, however, proved resilient, triggering another rebound. Throughout the week, crude oil has continued to trade between this established support at .84 and resistance at .25, with buyers and sellers consistently reacting to these critical technical junctures. Even a brief dip below the 38.2% retracement at .48 and the 100-hour moving average was swiftly countered by strong buying interest at .84, pushing prices back towards the upper end of the range.
Currently, crude oil is hovering near .00 as market participants anticipate a potential breakout. A sustained move beyond .25 could pave the way for a test of the 50% retracement at .01, signaling a bullish shift. Conversely, a decline below the 100-hour moving average, currently at .17, would draw attention back to the .84 support. A definitive break below this level could accelerate selling pressure towards the 200-hour moving average around .78. The market's next significant movement hinges on its ability to break free from the current .84-.25 trading range.
Understanding and respecting these market dynamics allows traders to make informed decisions. The persistent interplay between support and resistance levels underscores the importance of technical analysis in predicting potential future price trajectories. Observing how these boundaries are tested and ultimately breached will provide clear signals for the commodity's next significant directional move, highlighting the constant evolution and responsiveness inherent in financial markets.